VIC TOKAI(FY2008 to FY2010)
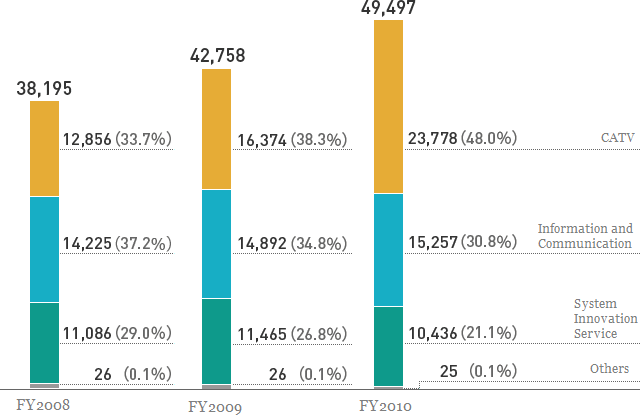
Segment Information
(Millions of Yen)
Balance Sheet
(Millions of Yen)
| Assets | March 31, 2009 | March 31, 2010 | March 31, 2011 |
|---|---|---|---|
| Current Assets | 7,563 | 9,964 | 11,034 |
| Cash and Deposits | 1,530 | 2,919 | 2,616 |
| Notes and Accounts Receivable | 3,970 | 4,206 | 4,480 |
| Merchandise and Finished Goods | 24 | 50 | 49 |
| Work in Process | 140 | 26 | 48 |
| Raw Materials and Supplies | 352 | 514 | 1,364 |
| Deferred Tax Assets | 361 | 500 | 541 |
| Others | 1,235 | 1,820 | 2,328 |
| Allowance for Doubtful Accounts | - 73 | - 73 | - 125 |
| Non-Current Assets | 36,225 | 51,288 | 58,700 |
| Property, Plant and Equipment | 33,199 | 42,699 | 47,185 |
| Buildings and Structures, Net | 24,494 | 30,477 | 32,272 |
| Machinery, Equipment and Vehicles, Net | 4,813 | 5,432 | 5,803 |
| Land | 1,608 | 2,371 | 2,419 |
| Leased Assets, Net | 1,223 | 2,427 | 4,263 |
| Construction in Progress | 195 | 72 | 179 |
| Others, Net | 865 | 1,918 | 4,850 |
| Intangible Assets | 1,844 | 6,904 | 9,304 |
| Goodwill | 997 | 6,018 | 8,478 |
| Leased Assets | 9 | 3 | 7 |
| Others | 837 | 881 | 818 |
| Investments and Other Assets | 1,181 | 1,684 | 2,210 |
| Investment Securities | 157 | 242 | 240 |
| Deferred Tax Assets | 361 | 410 | 564 |
| Others | 677 | 1,066 | 1,444 |
| Allowance for Doubtful Accounts | - 14 | - 35 | - 39 |
| Deferred Assets | 2 | 1 | 131 |
| Total Assets | 43,791 | 61,255 | 70,135 |
(Millions of Yen)
| Liabilities | March 31, 2009 | March 31, 2010 | March 31, 2011 |
|---|---|---|---|
| Current Liabilities | 22,756 | 27,999 | 28,366 |
| Accounts Payable - trade | 1,585 | 2,147 | 2,788 |
| Short-term loans Payable | 15,210 | 17,715 | 15,148 |
| Lease Obligations | 344 | 603 | 1,038 |
| Accounts Payable - other | 1,134 | 1,796 | 1,812 |
| Accounts Payable - facilities | 1,561 | 1,569 | 2,219 |
| Income Taxes Payable | 1,485 | 1,579 | 1,189 |
| Provision for bonuses | 373 | 501 | 475 |
| Asset Retirement Obligations | - | - | 33 |
| Others | 1,060 | 2,085 | 3,659 |
| Non-current Liabilities | 6,063 | 17,518 | 23,925 |
| Long-term loans Payable | 4,233 | 13,852 | 12,051 |
| Lease Obligations | 965 | 1,993 | 3,518 |
| Deferred tax Liabilities | 27 | 26 | 22 |
| Provision for Retirement Benefits | 112 | 260 | 306 |
| Provision for Directors' Retirement Benefits | 246 | 296 | 240 |
| Asset Retirement Obligations | - | - | 35 |
| Negative Goodwill | 51 | 47 | 42 |
| Others | 426 | 1,041 | 1,305 |
| Total Liabilities | 28,819 | 45,517 | 52,291 |
(Millions of Yen)
| Net Assets | March 31, 2009 | March 31, 2010 | March 31, 2011 |
|---|---|---|---|
| Shareholders' Equity | 14,908 | 15,311 | 17,192 |
| Capital Stock | 2,211 | 2,215 | 2,221 |
| Capital Surplus | 2,622 | 2,626 | 2,632 |
| Retained Earnings | 11,293 | 13,045 | 12,376 |
| Treasury Shares | - 1,220 | - 2,577 | - 37 |
| Valuation and Translation Adjustments | - 16 | 27 | 18 |
| Valuation difference on available-for-sale securities | - 16 | 27 | 18 |
| Subscription Rights to Shares | - | 11 | 29 |
| Minority Interests | 80 | 386 | 602 |
| Total Net Assets | 14,971 | 15,737 | 17,843 |
| Total Liabilities and net Assets | 43,791 | 61,255 | 70,135 |
Statement of Income
(Millions of Yen)
| March 31, 2009 | March 31, 2010 | March 31, 2011 | |
|---|---|---|---|
| Sales | 38,195 | 42,758 | 49,497 |
| Cost of sales | 23,720 | 24,842 | 28,057 |
| Gross profit | 14,474 | 17,915 | 21,439 |
| Selling, General and Administrative expenses | 9,971 | 12,374 | 15,051 |
| Operating Income | 4,502 | 5,540 | 6,338 |
| Non-operating Income | 61 | 49 | 70 |
| Non-operating Expenses | 328 | 355 | 514 |
| Ordinary Income | 4,235 | 5,235 | 5,943 |
| Extraordinary Income | 396 | 154 | 256 |
| Extraordinary Losses | 302 | 370 | 838 |
| Income before Income Taxes and Minority Interests | 4,328 | 5,019 | 5,361 |
| Income Taxes - current | 1,850 | 2,336 | 2,509 |
| Income Taxes - deferred | - 56 | - 166 | - 199 |
| Minority Interests in Income | 6 | 34 | 77 |
| Net Income | 2,528 | 2,815 | 2,974 |
Cash Flow Statement
(Millions of Yen)
| Assets | March 31, 2009 | March 31, 2010 | March 31, 2011 |
|---|---|---|---|
| Cash Flows from Operating Activities | 8,726 | 9,191 | 9,001 |
| Cash Flows from Investing Activities | - 10,658 | - 13,155 | - 10,767 |
| Cash Flows from Financing Activities | 1,501 | 5,216 | 1,464 |
| Net Increase (Decrease) in Cash and Cash Equivalents | - 430 | 1,252 | - 30 |
| Cash and Cash Equivalents at beginning of Period | 1,946 | 1,515 | 2,768 |
| Cash and Cash Equivalents at end of Period | 1,515 | 2,768 | 2,467 |